
Backtesting · Risk metrics
Max drawdown can double when measured daily instead of at month-end
Maximum drawdown = (peak NAV − lowest NAV after that peak) ÷ peak NAV, taken over the deepest fall anywhere on the net asset value (NAV) curve. A NAV that drops from 1.150 to 0.920 has a drawdown of (1.150 − 0.920) ÷ 1.150 = 20%, and until the NAV gets back to 1.150, any number of rebounds along the way still belong to that same drawdown.
On one and the same curve, sparser sampling can only give a smaller maximum drawdown or the same one, never a larger one. Look at that 20% drawdown through the last day of each month alone and it reads 10%, because neither the mid-month high nor the mid-month low was sampled. When you are handed a maximum drawdown figure, ask as well how often the NAV was recorded and whether it includes unrealized profit and loss on positions that are still open.
The maximum drawdown formula, and where a single drawdown starts and ends
A drawdown is how far the NAV sits below its highest point so far. For any day on the curve: drawdown = (highest NAV up to that day − that day's NAV) ÷ highest NAV up to that day. Every day has a drawdown, and the largest of them is the maximum drawdown (Max Drawdown, also written MDD in backtest reports).
- Walk forward from the first NAV, always keeping the highest NAV seen so far.
- At each new point, use the formula above to work out what percentage it is below that highest NAV.
- When the NAV makes a new high, replace the highest NAV with the new one; the drawdown at that point is 0.
- At the end of the curve, take the largest value that came up in step 2.
The denominator is the peak NAV, not the starting capital. An account that starts at a NAV of 1.000, rises to 1.150 and falls to 0.920 is down only (1.000 − 0.920) ÷ 1.000 = 8% against its starting capital, yet its maximum drawdown is 20%: someone who put money in on the day the NAV stood at 1.150 lost exactly that 20%.
A drawdown starts on the day of the peak and ends only when the NAV gets back to that peak or goes above it. If a rebound in between falls short of the old peak and a lower low follows, the valley moves later and the drawdown is still the same one. The valley therefore can't be fixed until the NAV makes a new high. If the curve ends before the NAV is back at the peak, what has been measured is only the depth as of that last day.
The CFTC's worst peak-to-valley draw-down is measured on month-end NAV
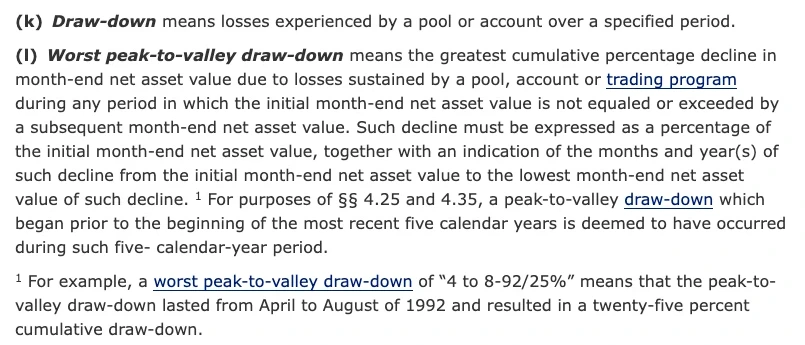
The rules of the US Commodity Futures Trading Commission (CFTC) govern how commodity pool operators and commodity trading advisors disclose performance to clients. 17 CFR § 4.10 is the definitions section, and two of its paragraphs deal with drawdown. Draw-down means losses experienced by a pool or account over a specified period. Worst peak-to-valley draw-down means the greatest cumulative percentage decline in month-end net asset value during any period in which the initial month-end net asset value is not equaled or exceeded by a subsequent month-end net asset value. The decline is expressed as a percentage of the initial month-end net asset value, together with the months and year(s) it ran from the initial month-end net asset value to the lowest month-end net asset value of the decline.
The footnote to that paragraph gives an example of the notation, 4 to 8-92/25%, meaning the peak-to-valley draw-down lasted from April to August of 1992 and came to a cumulative 25%.
Under this definition the peak and the valley can each fall only on a month-end. However high the NAV went in the middle of a month, or however low, it stays out of this number as long as the NAV had come back by month-end.
Two drawdown figures have to be listed in the disclosure. § 4.35 (Performance disclosures), in the subpart on commodity trading advisors, requires the largest monthly draw-down during the most recent five calendar years and year-to-date, expressed as a percentage of client funds, with the month and year indicated. It also requires the worst peak-to-valley draw-down over the same period, expressed as a percentage of net asset value, with the months and year indicated. The first looks at one month on its own and the second can run across several: with losses of 6% and 5% in two consecutive months, the largest monthly drawdown is 6% and the peak-to-valley drawdown is 1 − 0.94 × 0.95 = 1 − 0.893 = 10.7%.
Both sections sit in Part 4 of the CFTC's regulations, which covers commodity pool operators and commodity trading advisors. That doesn't mean grid bots or copy-trading pages on crypto platforms calculate drawdown the same way.
Month-end vs daily sampling of one NAV series: peak, valley and result
Take a NAV series recorded once a day, starting at 1.000, with these 11 points between June 30 and September 30:
| Date | NAV | Highest NAV to date | Below the highest NAV by | Month-end? |
|---|---|---|---|---|
| June 30 | 1.000 | 1.000 | 0 | Month-end |
| July 10 | 1.060 | 1.060 | 0 | |
| July 21 | 1.150 | 1.150 | 0 | |
| July 31 | 1.100 | 1.150 | 0.050 ÷ 1.150 ≈ 4.35% | Month-end |
| August 7 | 1.040 | 1.150 | 0.110 ÷ 1.150 ≈ 9.57% | |
| August 14 | 0.960 | 1.150 | 0.190 ÷ 1.150 ≈ 16.52% | |
| August 20 | 0.920 | 1.150 | 0.230 ÷ 1.150 = 20.00% | |
| August 31 | 0.990 | 1.150 | 0.160 ÷ 1.150 ≈ 13.91% | Month-end |
| September 10 | 1.050 | 1.150 | 0.100 ÷ 1.150 ≈ 8.70% | |
| September 18 | 1.010 | 1.150 | 0.140 ÷ 1.150 ≈ 12.17% | |
| September 30 | 1.120 | 1.150 | 0.030 ÷ 1.150 ≈ 2.61% | Month-end |
Table note: the NAVs are made-up numbers. On the days not listed, the NAV lies between the two neighboring rows, so the highest and the lowest of the daily points are both in the table. Column four = (highest NAV − that day's NAV) ÷ highest NAV.
With daily sampling, the highest NAV reached 1.150 on July 21 and was not exceeded afterwards, and the largest value in column four falls on August 20: (1.150 − 0.920) ÷ 1.150 = 0.230 ÷ 1.150 = 20%. The NAV rebounded to 1.050 on September 10 and slipped to 1.010 on September 18, a drop of 0.040 ÷ 1.050 ≈ 3.81%. Because the rebound stopped at 1.050, short of 1.150, that drop sits inside the drawdown that began on July 21 and doesn't count as a separate one.
With month-end sampling only four numbers are left: 1.000, 1.100, 0.990 and 1.120. The peak is the 1.100 of July 31, and August 31 stands at 0.990: (1.100 − 0.990) ÷ 1.100 = 0.110 ÷ 1.100 = 10%. The 1.150 of July 21 and the 0.920 of August 20 both fall mid-month and are never sampled.
| Sampling | Peak | Valley | Calculation | Maximum drawdown | Is this drawdown over by September 30? |
|---|---|---|---|---|---|
| Last day of each month | July 31, 1.100 | August 31, 0.990 | (1.100 − 0.990) ÷ 1.100 | 10% | Yes, 1.120 is above 1.100 |
| Every day | July 21, 1.150 | August 20, 0.920 | (1.150 − 0.920) ÷ 1.150 | 20% | Not yet, 1.120 is below 1.150 |
The curve is the same and one number is twice the other. Even the answer to whether the NAV is still in a drawdown comes out opposite: the month-end series had already made a new high by September 30, while the daily series was still 2.61% short of its peak.
The decline measured on month-end NAV falls entirely within August, and August's decline for the month, (1.100 − 0.990) ÷ 1.100, is also 10%. For this series the largest monthly drawdown and the month-end peak-to-valley drawdown happen to be the same number.
Daily sampling is still only one record a day. In a strategy backtest on historical candles, the NAV is recorded once at the close of each candle, so the drawdown from a backtest on daily candles can't see the intraday lows. Keep the fills the same and switch to hourly candles so that the NAV is recorded more densely, and the drawdown measured over the same stretch of market can only be larger or equal. To compare the maximum drawdowns of two strategies, the sampling frequency has to be the same; a month-end figure and a daily figure can't be compared directly.
Why does realized P&L alone understate drawdown for a strategy that is always in a position?
Net asset value in § 4.10 means total assets minus total liabilities, with each position in a commodity interest accounted for at fair market value. With positions carried at market value, the unrealized P&L on anything not yet closed is inside the NAV, and drawdown is measured on that curve, unrealized P&L included.
Take a strategy that is always in a position, with 10,000 USDT of capital, at two points in time:
- First point: closed trades have made a cumulative 200, the open position shows an unrealized gain of 200, and the NAV is 10,000 + 200 + 200 = 10,400.
- Second point: realized P&L has risen to 500, the price has fallen and the position shows an unrealized loss of 1,660, and the NAV is 10,000 + 500 − 1,660 = 8,840.
Measured on NAV, the drawdown is (10,400 − 8,840) ÷ 10,400 = 1,560 ÷ 10,400 = 15%. Plot realized P&L alone and the two points are 10,200 and 10,500, a new high each time, for a drawdown of 0.
Grid and martingale strategies both keep buying on the way down. Profit from the lots that have already been paired off and sold keeps adding up, while the loss stays in the holdings that haven't been sold. The realized P&L curve can't see that part, and the deeper the price falls, the further it drifts from the NAV curve.
To keep your own NAV record, note total account equity at a fixed time every day: the quote-currency balance plus the holdings valued at the market price at that moment. A day on which money is added to the strategy or taken out of it needs separate handling: subtract the deposit or withdrawal from that day's change in NAV. Otherwise a single deposit makes the NAV look as if it had reached a new high, and a drawdown that hasn't finished is wiped off the record.
How much gain does it take to recover from a 50% drawdown?
It takes a 100% gain. Start from a NAV of 1 and lose x, and 1 − x is left. Getting back to 1 means multiplying by 1 ÷ (1 − x), which is a gain of 1 ÷ (1 − x) − 1 = x ÷ (1 − x). The loss is measured against the peak and the gain against the low, and because the low is the smaller number, the gain needed to recover is larger than the loss.
| Drawdown x | NAV left, 1 − x | Gain to recover, x ÷ (1 − x) | Check |
|---|---|---|---|
| 10% | 0.90 | 0.10 ÷ 0.90 ≈ 11.1% | 0.90 × 1.111 ≈ 1.00 |
| 20% | 0.80 | 0.20 ÷ 0.80 = 25% | 0.80 × 1.25 = 1.00 |
| 30% | 0.70 | 0.30 ÷ 0.70 ≈ 42.9% | 0.70 × 1.429 ≈ 1.00 |
| 50% | 0.50 | 0.50 ÷ 0.50 = 100% | 0.50 × 2 = 1.00 |
| 75% | 0.25 | 0.75 ÷ 0.25 = 300% | 0.25 × 4 = 1.00 |
| 90% | 0.10 | 0.90 ÷ 0.10 = 900% | 0.10 × 10 = 1.00 |
Drawdowns of 30% and 50% are only 20 percentage points apart, but the gains needed to recover are 42.9% and 100%. The deeper the drawdown, the larger the gain it takes to make up each further percentage point of loss.
Back to the three-month series. With daily sampling, the valley at 0.920 needs a gain of 0.20 ÷ 0.80 = 25% to get back to 1.150 (0.920 × 1.25 = 1.150); the 1.120 of September 30 is 1.120 ÷ 0.920 − 1 ≈ 21.7% above the valley, which isn't enough yet. With month-end sampling, getting from the valley at 0.990 back to 1.100 takes 0.10 ÷ 0.90 ≈ 11.1%, and by September 30 the NAV is already 1.120 ÷ 0.990 − 1 ≈ 13.1% above 0.990.
The maximum drawdown in a backtest report is the deepest one that occurred in that stretch of history, and a different stretch of market can go deeper. If the parameters were tuned again and again to smooth away one ugly drawdown, the reported number will come out on the small side, which is one reason a backtest looks great and live trading loses money.